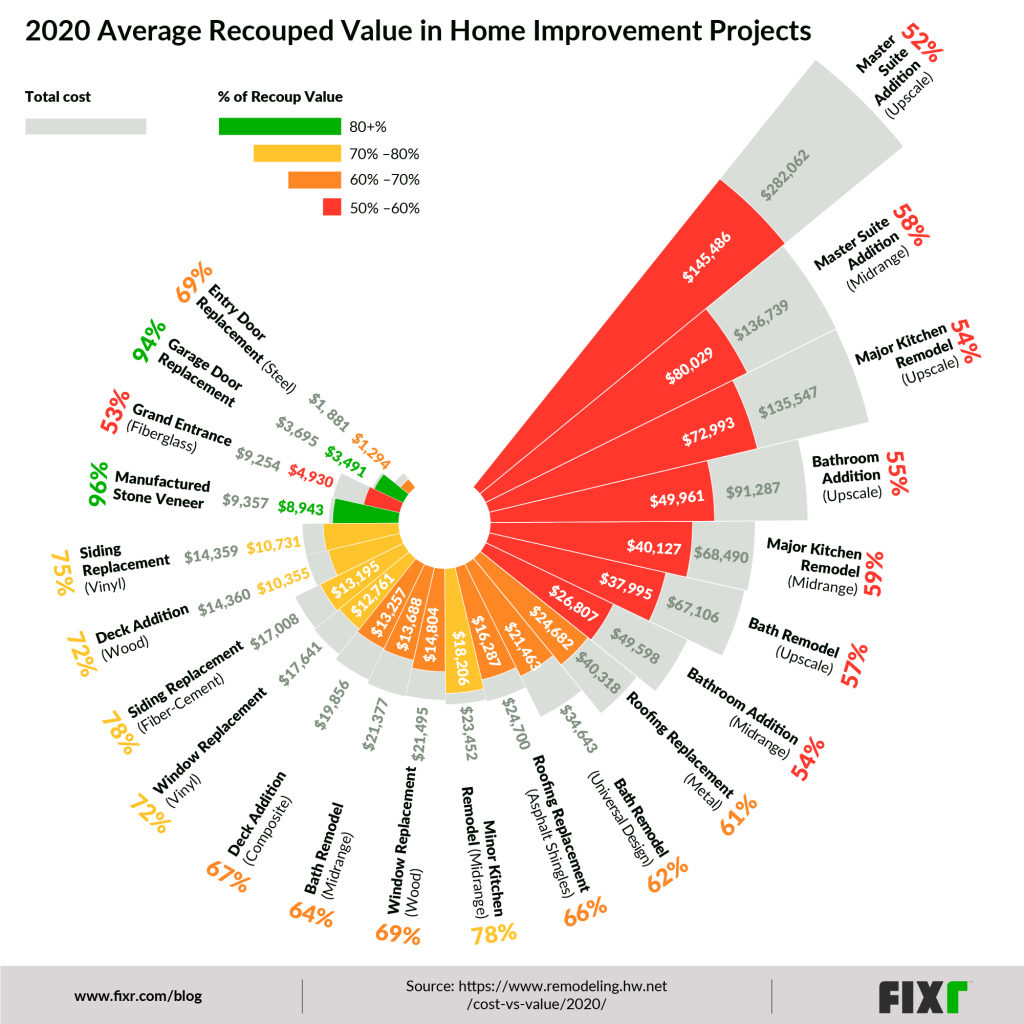
For the third year running, Fixr.com has produced a creative visual re-imagination of the major findings of the Cost vs. Value report.
The color-coded spiral chart shows the national average cost for 22 remodeling projects, plus the value that real-estate professionals in over 100 U.S. markets say those projects would add to a home’s price. The Cost vs. Value report centers on the percentage of costs recouped by building owners, and Fixr includes this in its summary of the major takeaways from the 2020 Cost vs. Value report. The chart offers a visual reference, allowing viewers to see the projects ranked from most expensive to least expensive. Fixr also shares the percentage of cost recouped for each project, with colors assigned to the different ranges.
Fixr
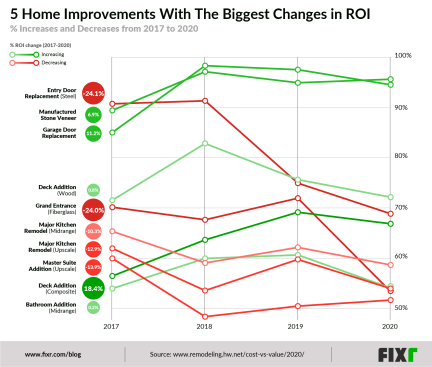
Given that fluctuation may occur in the project categories included in the Cost vs. Value report, Fixr created a historical chart mapping projects with the largest change in price recouped over the past four years. The chart presents an easily digestible snapshot of how costs recouped for reoccurring Cost vs. Value projects have changed over time to see what real estate professionals are placing higher and lower values on relative to 2017.
The full Cost vs. Value report is available online and local reports can be downloaded for the metro areas analyzed in the report.