
Most remodelers treat estimating as a pricing exercise. Build the COGS (cost of goods sold) list, apply a margin, sell the job. However, this common approach sells the process short, and we miss out on the valuable financial data needed to run not just projects but the overall business.
When executed thoughtfully, an estimate is the blueprint for job costing, cost-to-complete tracking, and, ultimately, the accuracy of your monthly and quarterly financials. In this article, I’ll walk through how I build estimates at TDS Design Build using the metrics of volume per week (VPW) and gross profit per day (GP/day). Then, in my next article, I’ll explain how I use those same estimates as a basis for project job-costing and month-end accounting.
Coded COGS List
A clean COGS list is a prerequisite for clean job costing later. It should read like a ledger broken down by cost codes for your core project tasks. At TDS, we have 25 cost codes, seven of which focus on our self-perform work:
0300-General Requirements
0400-Demo
0700-Framing
1200-Decks and Porches
2100-Interior Trim
2200-Cabinetry
2300-Specialties
We break each cost code into four categories:
.L — Self-performed labor
.M — Materials
.S — Trade partners/subs
.O — Other costs (permits, rentals, testing, etc.)
This structure aligns our estimating spreadsheet with Job Tread’s job-costing system, which means that once a project is sold:
Labor flows into the Job Tread system from time cards.
Materials and Other flow in from receipt and invoice uploads.
Trade-partner costs automatically log from bills and purchase orders.
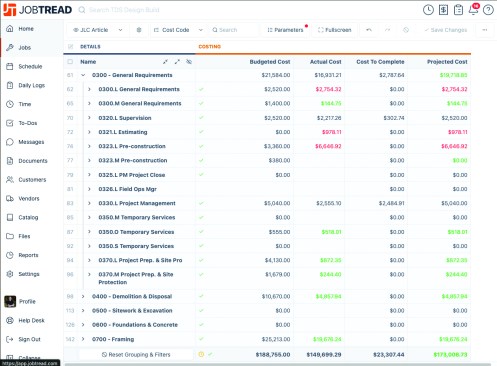
This screen shot demonstrates how the author’s cost-code structure for COGS aligns with Job Tread’s job-cost system.
Volume per Week
Once the COGS list is complete, we finally look at the total with different durations and margins applied. This is where VPW enters the picture.
VPW is our historical throughput metric—the average revenue per week that our team produces on similar projects (see “How Long Will This Take? Leveraging Volume per Week,” NovDec/2025). For certain scopes, we know our VPW range. For example, kitchens, baths, dormers, and small additions have a range of $13,000 to $18,000 VPW.
If the estimate produces a revenue total that results in a duration outside that range—say 35 to 40 weeks in a category where we typically run 12 to 18 weeks—then the estimate is wrong, the scope is wrong, or our plan for executing it is wrong.
Large gaps in VPW are not just scheduling concerns. They break:
Project management budgets.
Overhead recovery.
Labor utilization.
Cash flow timing.
Forecast accuracy.
VPW is the first check that the estimate reflects how the work will move through our system. If the VPW does not line up with our averages, we add or subtract weeks of duration. This action increases or decreases our duration-based 0300 General Requirements COGS—like project-management labor and equipment rentals—and updates the cost of the project. Only once the duration is set can the estimate move forward.
Gross Profit per Day
Next, we run the estimate through GP/day, the metric that ties revenue to the company budget. The formula is straightforward:
GP/day = annual gross profit target ÷ 365 ÷ number of concurrently running projects
Applying this formula effectively requires an understanding of your company’s capacity. While kitchens, baths, dormers, and small additions generate similar VPWs, their varying durations mean they realize different amounts of gross profit if a common gross profit percentage is used. For example, if the following are all priced at the same 32% margin:
A $175,000, 12-week kitchen project yields $667 GP/day.
A $110,000, 8-week bath project $628 GP/day.
A $250,000, 16-week addition project yields $714 GP/day.
A $125,000, 8-week dormer project yields $714 GP/day.
Running these jobs in a consistent loop could generate $2,723 in GP/day, but that requires always having a larger anchor project with a higher GP/day to offset the low GP/day of the smallest project. For us, GP/day is non-negotiable. If the projected duration and projected gross profit don’t meet our GP/day target, the job will choke the business financially. Nine times out of 10, that means the margin needs to increase. Let’s look at these examples again but with an equalized GP/day of $681:
The 12-week kitchen project costs $176,183 at 32.5% margin.
The 8-week bath project costs $112,936 at 33.8% margin.
The 16-week addition project costs $246,272 at 31% margin.
The 8-week dormer project costs $123,136 at 31% margin.
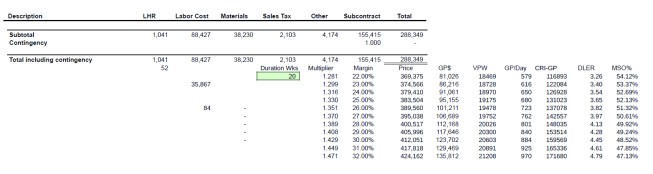
This summary of one of the author’s estimates demonstrates how VPW, GP/day, and other metrics provide data to improve decision making when applying margins.
Bottom Line
This subtle change to margin application builds a system that supports your company’s financial needs regardless of project type. It is easy to stop at “Does this price sound right?”, but a better question is “Does this price support the company’s financial engine at the pace required to run the business?”
Regardless of your pricing strategy, the foundation for accurate job costing and company financials is an organized estimate built on a trackable cost-code structure. In the next article, I will break down the steps that I take to use my estimates to track project performance and build month-end financials.